 Unknown
Question: 7 In a group of 15 high schools students, 7 study Latin, 8 study French and 3 study Neither Latin nor French. How many students study both Latin and French?
Explore: Let, no. of students study both Latin & French = x
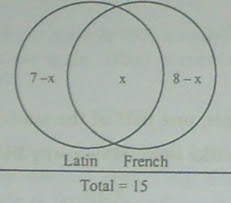 Using Venn diagram
7-x +x+8-x+3 = 15
=> 18-x = 15
=> x = 18-15
=> x = 3
Answer: 3 students study both.
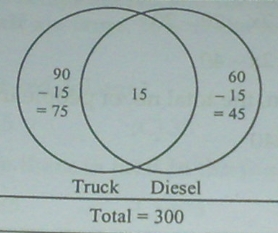
Question: 8 A motor poll has 300 vehicles of which 30% are trucks, 20% of all the vehicles in the motor poll are diesel, including 15 trucks. What percent of the motor poll is composed of vehicles that are neither trucks nor diesel?
Explore: Total no of trucks = 300x30% = 90
No. of diesel vehicles = 300x 30% = 60
No. of diesel trucks = 15
Using Ven diagram
No. of vehicles neither truck nor diesel = 300 - (75+15+45)
= 300-135
= 165
Percentage = (165/300)100%
= 55%
Question:9 In a class of 24 student, one half of the students like movie A & one-third like movie B, and 1/4 like both. How many like neither ?
(a) 6 (b) 8 (c) 9 (d) 10 (e) 11
Explore:
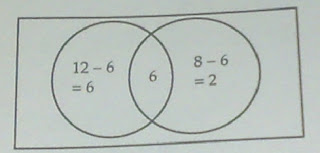
6+6+2+x = 24
=>x = 24-14 = 10
Answer (D)
Question:10 A picnic was attended by 240 persons. There were 20 more men than women and 20 more adults then children. How many men were there in the picnic?
(a) 240 (b) 750 (c) 110 (d) 130 (e) 200
Explore: Let,
x be the number of men in the picnic
:. Number of women = x-20
:. Total number of adults = 2x - 20
:. Number of children = 2x-20-20
= 2x-40
According to the problem, the total no. Of people in the picnic is 240.
:. X+X-20+2x-40 = 240
=> 4X - 60 = 240
=> 4X = 300
=> X = 300/4 = 75
Question: 11 In a club 60% members are male & 70 % members are graduates. Also 50% of the graduate members are male. What percentage of the club members are female & none graduate?
(a) 40 (b) 20 (c) 15 (d) 10 (e) 5
Explore: Drawing the Venn diagram for this problem is tricky. Note that, male & female members are completely distinct sets. They don't intersect. and the set of graduates have both male & female members. So with the information given, we can draw the following Venn diagram:
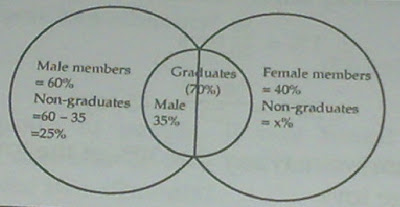 Let, X be the percentage of female non-graduate members. So, adding up all the regions
100 = 25 + 70 + X
(Male non-Graduates) (Graduates) (Female non-Graduate)
:. X = 100 - 95 = 5
Answer: (E)
Question: 12 In a production lot 40 % toys are red and the remaining are green. Half of the toys are small and half are large. 10% of the toys are red and small and 30 toys are green & large.
(1) How many toys are red & large?
(a) 60 (b) 45 (c) 30 (d) 25 (e) None
(2) How many toys are there in total in the production lot?
(a) 225 (b) 125 (c) 175 (d) 200 (e) 150
Explore: Let us draw a Venn diagram of the situation described in the problem.
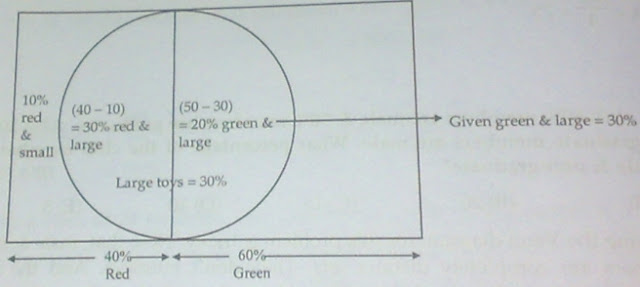
So, according to diagram, we have 20% green & large toys. So,
20% = 30 toys
:. 1 % = 30/20 toys
:. 30% (30x30)/20 = 45 toys
Since from diagram we may say that 30% of the toys are large & red, hence we have 45 red & large toys.
Answer: (b)(1)
Now, 1% = 30/20 toys
:. 100% = (30 /20)x 100
= 150 toys
Answer: (2)(e)
Question: 13 Saplings are to be planted 30 feet apart along one side of a straight lane 455 feet long. If the first sapling is to be planted at one end of the lane, how may saplings are needed?
(a) 18 (b) 16 (c) 15 (d) 14 (e) 13
Explore: 455 is not divisible by 30. But 450 is divisible [450/30 = 15]
But since the first sapling is to be planted at one end of the lane, so, according to counting principle, the number of saplings needed is 15 + 1 = 16.
Answer: (b)
Explore: Let, no. of students study both Latin & French = x
7-x +x+8-x+3 = 15
=> 18-x = 15
=> x = 18-15
=> x = 3
Answer: 3 students study both.
Question: 8 A motor poll has 300 vehicles of which 30% are trucks, 20% of all the vehicles in the motor poll are diesel, including 15 trucks. What percent of the motor poll is composed of vehicles that are neither trucks nor diesel?
Explore: Total no of trucks = 300x30% = 90
No. of diesel vehicles = 300x 30% = 60
No. of diesel trucks = 15
No. of vehicles neither truck nor diesel = 300 - (75+15+45)
= 300-135
= 165
Percentage = (165/300)100%
= 55%
Question:9 In a class of 24 student, one half of the students like movie A & one-third like movie B, and 1/4 like both. How many like neither ?
(a) 6 (b) 8 (c) 9 (d) 10 (e) 11
Explore:
6+6+2+x = 24
=>x = 24-14 = 10
Answer (D)
Question:10 A picnic was attended by 240 persons. There were 20 more men than women and 20 more adults then children. How many men were there in the picnic?
(a) 240 (b) 750 (c) 110 (d) 130 (e) 200
Explore: Let,
x be the number of men in the picnic
:. Number of women = x-20
:. Total number of adults = 2x - 20
:. Number of children = 2x-20-20
= 2x-40
According to the problem, the total no. Of people in the picnic is 240.
:. X+X-20+2x-40 = 240
=> 4X - 60 = 240
=> 4X = 300
=> X = 300/4 = 75
Question: 11 In a club 60% members are male & 70 % members are graduates. Also 50% of the graduate members are male. What percentage of the club members are female & none graduate?
(a) 40 (b) 20 (c) 15 (d) 10 (e) 5
Explore: Drawing the Venn diagram for this problem is tricky. Note that, male & female members are completely distinct sets. They don't intersect. and the set of graduates have both male & female members. So with the information given, we can draw the following Venn diagram:
100 = 25 + 70 + X
(Male non-Graduates) (Graduates) (Female non-Graduate)
:. X = 100 - 95 = 5
Answer: (E)
Question: 12 In a production lot 40 % toys are red and the remaining are green. Half of the toys are small and half are large. 10% of the toys are red and small and 30 toys are green & large.
(1) How many toys are red & large?
(a) 60 (b) 45 (c) 30 (d) 25 (e) None
(2) How many toys are there in total in the production lot?
(a) 225 (b) 125 (c) 175 (d) 200 (e) 150
Explore: Let us draw a Venn diagram of the situation described in the problem.
So, according to diagram, we have 20% green & large toys. So,
20% = 30 toys
:. 1 % = 30/20 toys
:. 30% (30x30)/20 = 45 toys
Since from diagram we may say that 30% of the toys are large & red, hence we have 45 red & large toys.
Answer: (b)(1)
Now, 1% = 30/20 toys
:. 100% = (30 /20)x 100
= 150 toys
Answer: (2)(e)
Question: 13 Saplings are to be planted 30 feet apart along one side of a straight lane 455 feet long. If the first sapling is to be planted at one end of the lane, how may saplings are needed?
(a) 18 (b) 16 (c) 15 (d) 14 (e) 13
Explore: 455 is not divisible by 30. But 450 is divisible [450/30 = 15]
But since the first sapling is to be planted at one end of the lane, so, according to counting principle, the number of saplings needed is 15 + 1 = 16.
Answer: (b)
 Posted in:


